on
A Deep Dive into Core Dumps on iOS
Core Dump Basics
A core dump is a file that contains the complete memory state and general
purpose registers of
a process at a specific point in time. The main use for core dumps is usually
debugging. Debuggers like gdb and lldb can load core dumps and inspect the
program’s memory including its stack trace, registers, and more.
Some systems generate core dumps automatically if certain exceptions occur and
the process crashes. Unix systems usually use the Exectuable and Linkable Format
(ELF), whereas
macOS and its derivates like iOS use the
Mach-O format. This blog post focuses
on Mach-O user space core dumps created with lldb.
Core Dumps for Fuzzing
A core dump can be used to transplant a process from one system to another.
User space core dumps can be created at an interesting point of execution on an
iPhone with lldb and debugserver. For example, this might be right after
receiving a buffer via the network. Such a core dump - or for our purposes
snapshot - can then be used as a starting point for fuzzing on a server with
a snapshot fuzzer. More details of how this will work will be released in the
following posts.
Getting a core dump from an iPhone
Requirements
- XCode installed on macOS (Big Sur)
- Jailbroken iPhone (14.3)
debugserver acts as a server for gdb or lldb that can run on the iPhone.
To get the correct version of debugserver, extract the binary from the
DeveloperDiskImage on your Mac with the following commands.
mac$> hdiutil attach /Applications/Xcode.app/Contents/Developer/Platforms/iPhoneOS.platform/DeviceSupport/14.3/DeveloperDiskImage.dmg
mac$> cp /Volumes/DeveloperDiskImage/usr/bin/debugserver ./
Next, copy the debugserver binary and the following entitlements.xml to
your iPhone with scp.
mac$> scp entitlements.xml ipwn:/bin/
mac$> scp debugserver ipwn:/bin/
Mark the debugserver binary as executable and sign it with ldid so that
the binary gets the necessary entitlements for debugging other processes.
iPhone#> cd /bin
iPhone#> chmod +x debugserver
iPhone#> ldid -Sentitlements.xml debugserver
Test program
I use the following simple C program which adds to integers and returns the result as a status code as an example.
Clang compiles the C program on the Mac to an ARM64e binary. Copy the
binary with scp to the iPhone.
mac$> clang -arch arm64e add.c -o add -isysroot /Applications/Xcode.app/Contents/Developer/Platforms/iPhoneOS.platform/Developer/SDKs/iPhoneOS.sdk
mac$>scp add ipwn:/bin/emu/
On the iPhone, mark the add binary as executable with chmod and sign it with
ldid. When the ./add programm is executed, the return value is 7. If these
steps work, you can start the debugserver to listen on all interfaces on port
5555 and load the add binary.
iPhone#> cd /bin/emu
iPhone#> chmod +x add
iPhone#> ldid -S add
iPhone#> ./add
iPhone#> echo $?
7
iPhone#> ./debugserver 0.0.0.0:5555 add
On the Mac, start lldb with the add binary and select the platform
remote-ios. Finally, attach to the remote process with the process connect
command. After a few seconds, you should receive the following output.
mac#>lldb add
(lldb) target create "add"
Current executable set to 'add' (arm64e).
(lldb) platform select remote-ios                                                                           Platform: remote-ios
 Connected: no
  SDK Path: error: unable to locate SDK
(lldb) process connect connect://192.168.178.148:5555
Process 1937 stopped
* thread #1, stop reason = signal SIGSTOP
    frame #0: 0x0000000103059000 dyld`_dyld_start
dyld`_dyld_start:
->  0x103059000 <+0>:  mov    x28, sp
    0x103059004 <+4>:  and    sp, x28, #0xfffffffffffffff0
    0x103059008 <+8>:  mov    x0, #0x0
    0x10305900c <+12>: mov    x1, #0x0
Target 0: (add) stopped.
If everything went right, you can use lldb to disassemble, set breakpoints and
continue the execution as I did below. When you are at the desired point of
execution, you can create a core dump with the process save-core command.
This command will probably take several minutes and result in a roughly
2GB large file.
(lldb) di -n main
add`main:
    0x102c73f8c <+0>:  sub    sp, sp, #0x10             ; =0x10
    0x102c73f90 <+4>:  str    wzr, [sp, #0xc]
    0x102c73f94 <+8>:  mov    w8, #0x3
    0x102c73f98 <+12>: str    w8, [sp, #0x8]
    0x102c73f9c <+16>: mov    w8, #0x4
    0x102c73fa0 <+20>: str    w8, [sp, #0x4]
    0x102c73fa4 <+24>: ldr    w8, [sp, #0x8]
    0x102c73fa8 <+28>: ldr    w9, [sp, #0x4]
    0x102c73fac <+32>: add    w0, w8, w9
    0x102c73fb0 <+36>: add    sp, sp, #0x10             ; =0x10
    0x102c73fb4 <+40>: ret
(lldb) b main
Breakpoint 1: where = add`main, address = 0x0000000102c73f8c
(lldb) c
Process 1937 resuming
Process 1937 stopped
* thread #1, queue = 'com.apple.main-thread', stop reason = breakpoint 1.1
    frame #0: 0x0000000102c73f8c add`main
add`main:
->  0x102c73f8c <+0>:  sub    sp, sp, #0x10             ; =0x10
    0x102c73f90 <+4>:  str    wzr, [sp, #0xc]
    0x102c73f94 <+8>:  mov    w8, #0x3
    0x102c73f98 <+12>: str    w8, [sp, #0x8]
Target 0: (add) stopped.

(lldb) process save-core core_dump_add
0x00000019 0x00000048 [0x0000000102c6c000 - 0x0000000102c70000) [0x0000000000002000 0x0000000000004000) 0x00000005 0x00000005 0x00000000 0x00000000]
0x00000019 0x00000048 [0x0000000102c70000 - 0x0000000102c74000) [0x0000000000006000 0x0000000000004000) 0x00000005 0x00000005 0x00000000 0x00000000]
...
Saving 16384 bytes of data for memory region at 0x102c6c000
Saving 16384 bytes of data for memory region at 0x102c70000
...
Core Dump Internals
User space core dumps can be created with the process save-core command in
lldb.
As a quick disclaimer, there will be some major changes in the upcoming months
to lldb’s process save-core command for Darwin systems. The developers
added support for
skinny core files
that only contain dirty/modified memory. This reduces the size of core dumps
from usually around 2GB to a few KB or MB’s. The drawback is that the core dump
must be debugged on the same system it was taken on. There will be a
--style option that should be set to full to get the complete core dump.
With the upcoming changes out of the way, let’s take a look at how these
core dumps are created. The source code
of lldb’s ObjectFileMachO::SaveCore() function lets us reconstruct the core
dump format.
This function creates the actual core dump file which is a Mach-O file. The following steps are taken:
- Check for supported architecture
- Create vector of
SEGMENT_COMMAND_64s containing memory regions and their protections - Create Mach-O Header
- Create vector of
LC_THREADs containing thread data - Calculate number of commands and size of commands in Mach-O
- Write Header,
LC_THREADs, andSEGMENT_COMMAND_64s to file and zero fill non-readable pages
Mach-O File Format
Mach-O is a very flexible file format. A Mach-O file can contain multiple executables, object files, shared libraries, or core dumps. Depending on the usage, the Mach-O file might only contain a subset of the features. This is the case for core dumps.
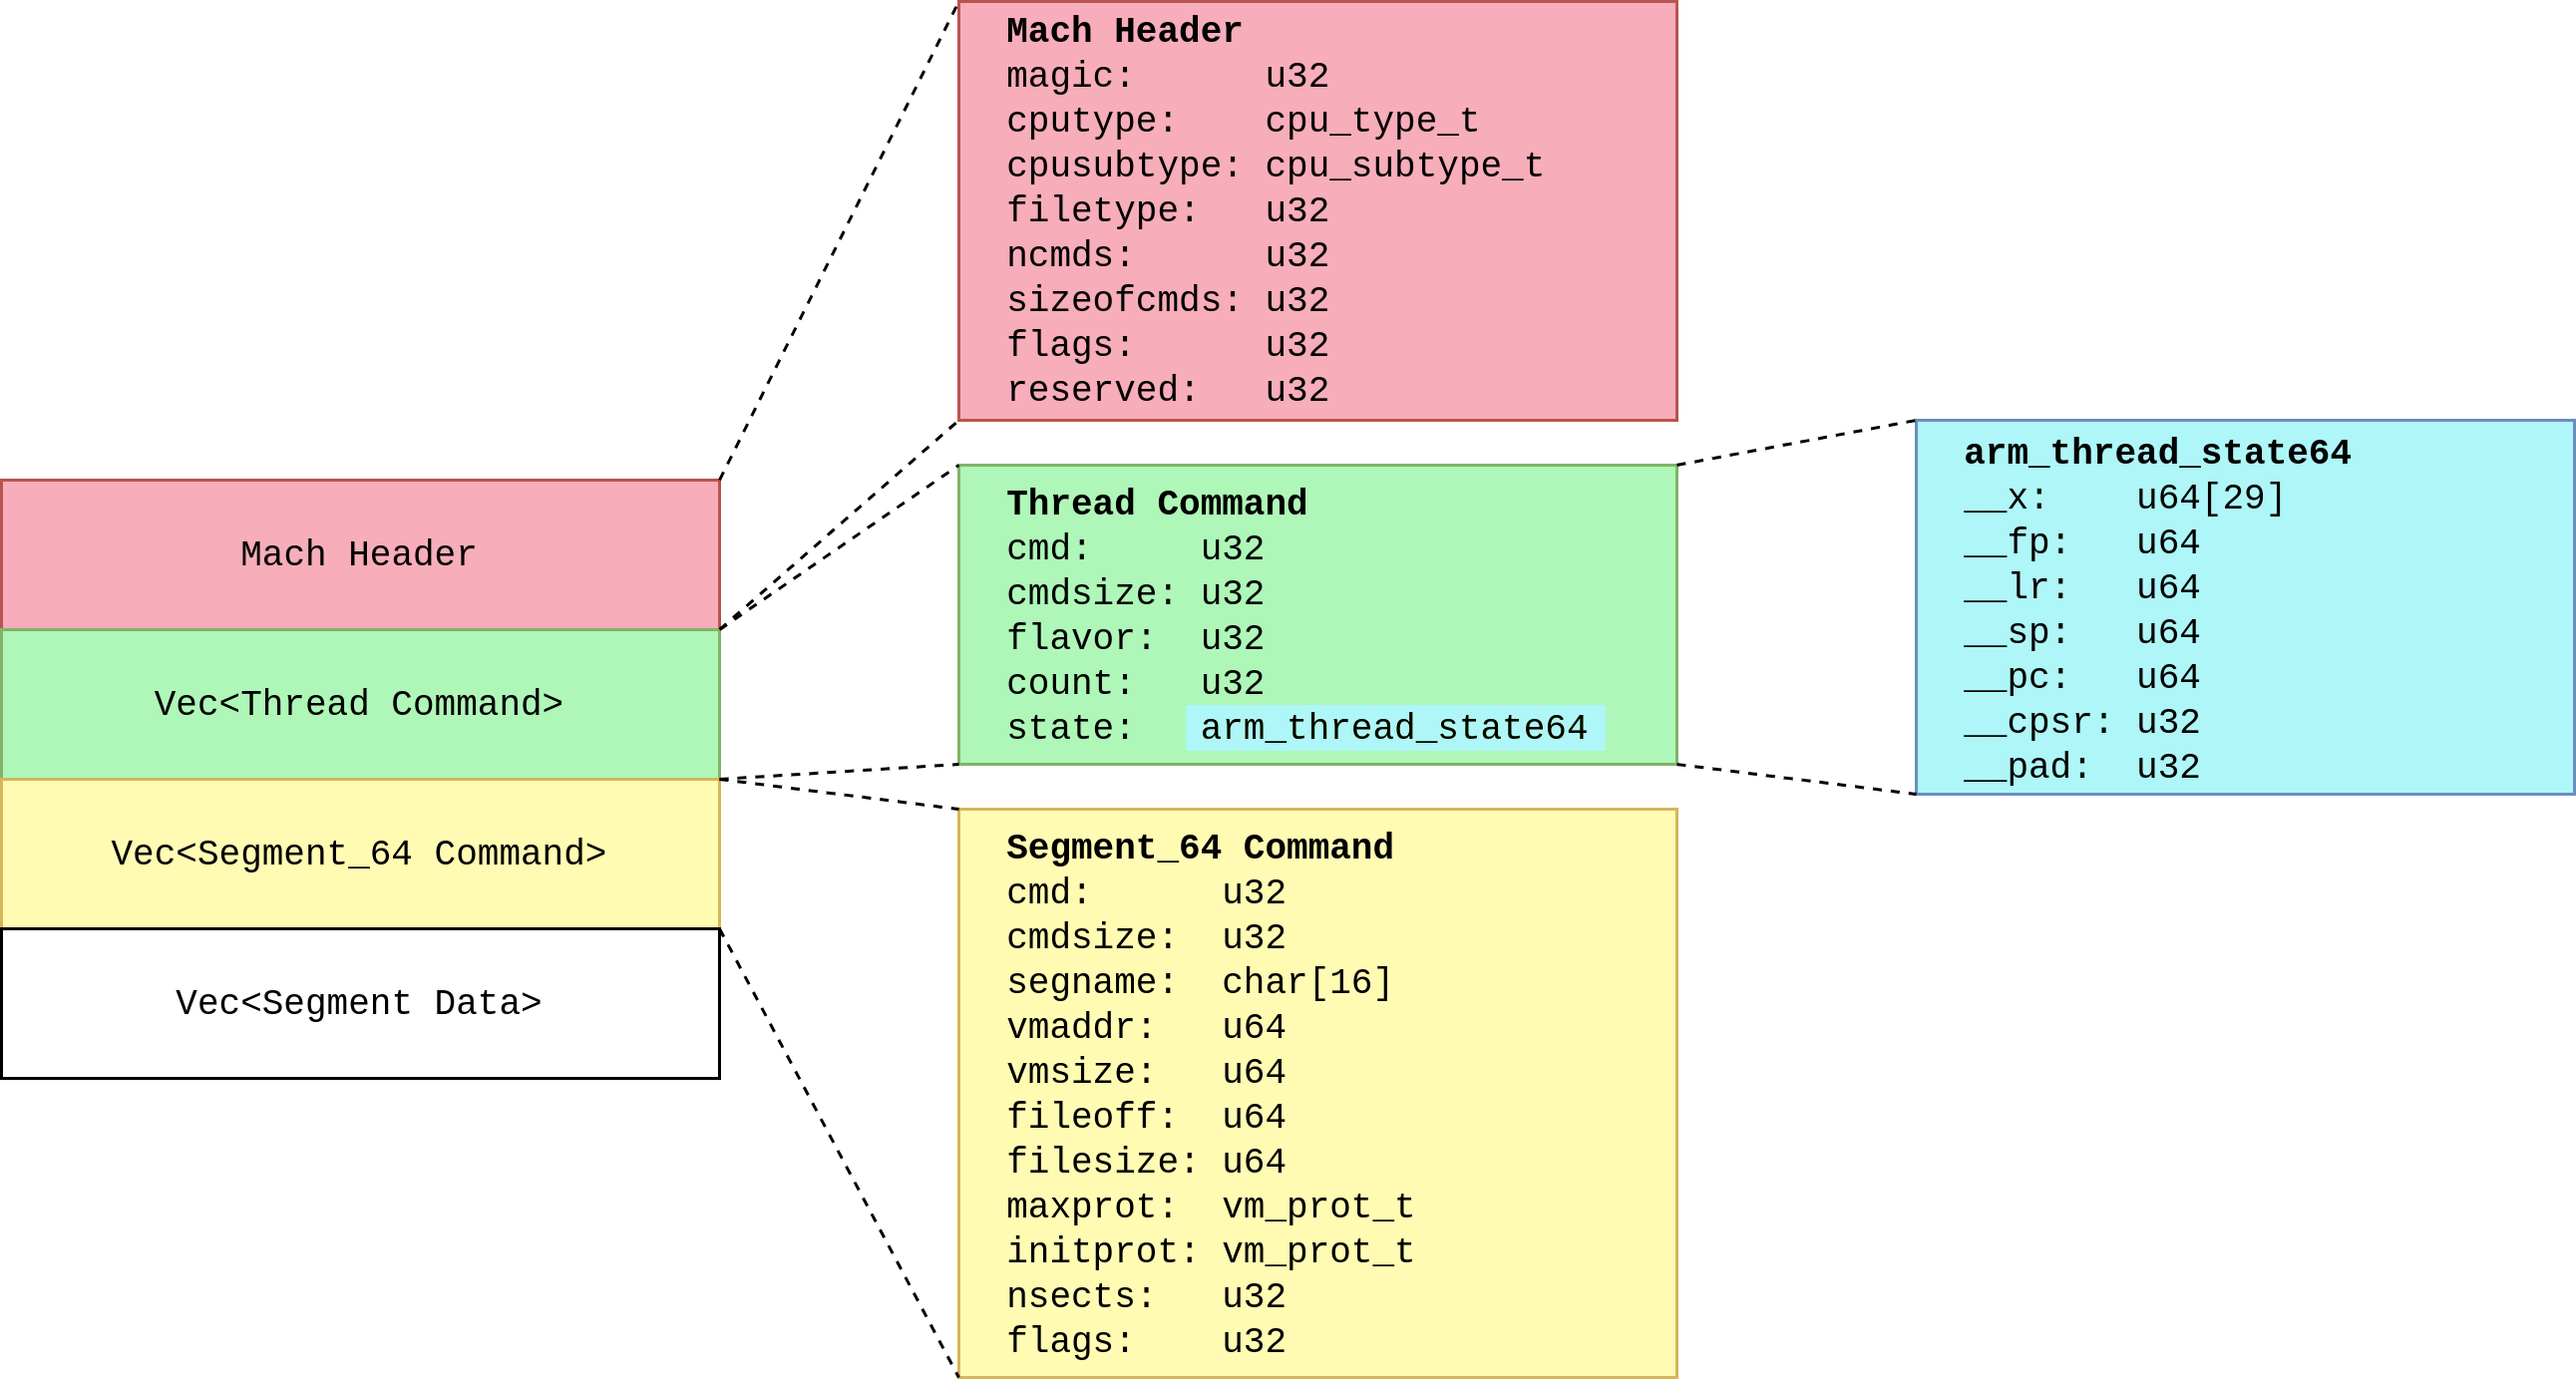
Mach-O Core Dump File Structure
The diagram above shows the structure of a Mach-O core dump file generated by lldb. Apple releases the darwin-xnu source code that includes the relevant header files that define the possible values. Firstly, the core dump starts with the Mach Header that contains the following data:
- magic: 0xcffaedfe for 64-bit, little-endian
- cputype: cpu specifier, 0x0100000c stands for 64-bit ARM
- cpusubtype: machine specifier, 0x02 stands for ARM64e
- filetype: type of file
- ncmds: number of load commands
- sizeofcmds: the size of all load commands
- flags: flags
- reserved: reserved
The load commands follow the Mach Header. A Mach-O core dump only uses two
types of load commands. Firstly, the thread_commands contain information
about each thread in the program and its state, i.e. its general purpose
registers. The
segment_command_64s follow after the thread_command. These contain
information about the memory regions which are stored in the core dump.
The core dump contains the same number of thread_commands as threads
were used by the process while taking the core dump. The thread_command
contains the following fields:
- cmd: always 0x04, defined as
LC_THREAD - cmdsize: total size of command
- flavor: flavor of the thread state, 0x6 stands for ARM_THREAD_STATE64
- count: number of u32 in state
- state: contains registers
The segment_command_64s contain the following fields:
- cmd: always 0x19, defined as
LC_SEGMENT_64 - cmdsize: size of
section_64struct, not relevant in core dump - segname: segment name in ASCII, always zeros in core dump
- vmaddr: memory address of this segment
- vmsize: memory size of this segment
- fileoff: file offset of this segment, references offset in core dump
- filesize: amount to map from the file
- maxprot: maximum VM protection, read | write | execute
- initprot: initial VM protection, always same as maxprot in core dump
- nsects: number of sections in segment, always zero in core dump
- flags: flags, always 0 in core dump
After the load commands, the actual memory contents are written to the core dump file.
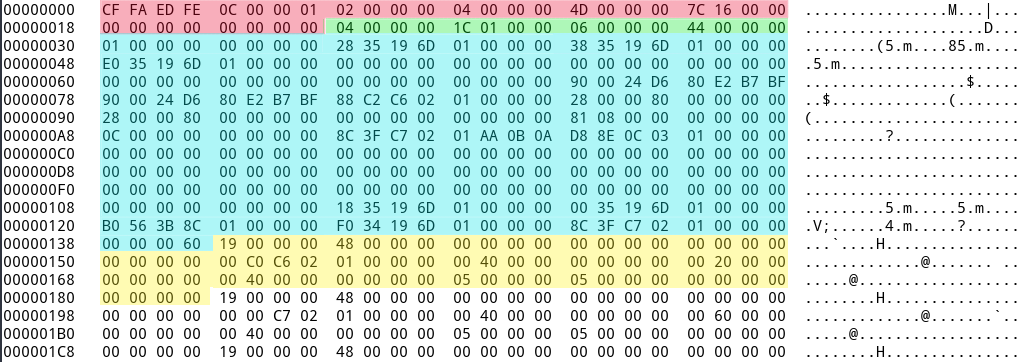
Mach-O Core Dump in Hex
This image shows the first 0x1DF bytes of the actual core dump taken above. The first eight words contain the Mach Header. The thread command in green and the thread state in blue follow. The first segment_command_64 in yellow is 18 words long. The core dump contains multiple of these segment commands before the actual data.
Update: Floating Point, Exception, and AMX Registers
While loading the core dump into an emulator, I realized that it does not contain floating point, exception, or AMX registers. In order to dump store them, I wrote a small script called snapshot.py. This can be loaded and executed before or after taking the core dump with the following commands. All registers will be stored in the reg.dmp file.
(lldb) command script import /path/to/snapshot.py
(lldb) command script add -f snapshot.snapshot snapshot
(lldb) snapshot
Outlook
I will release a Mach-O core dump parser written in Rust with my next blog post. This library will be used to load the snapshot of the process into the emulator.